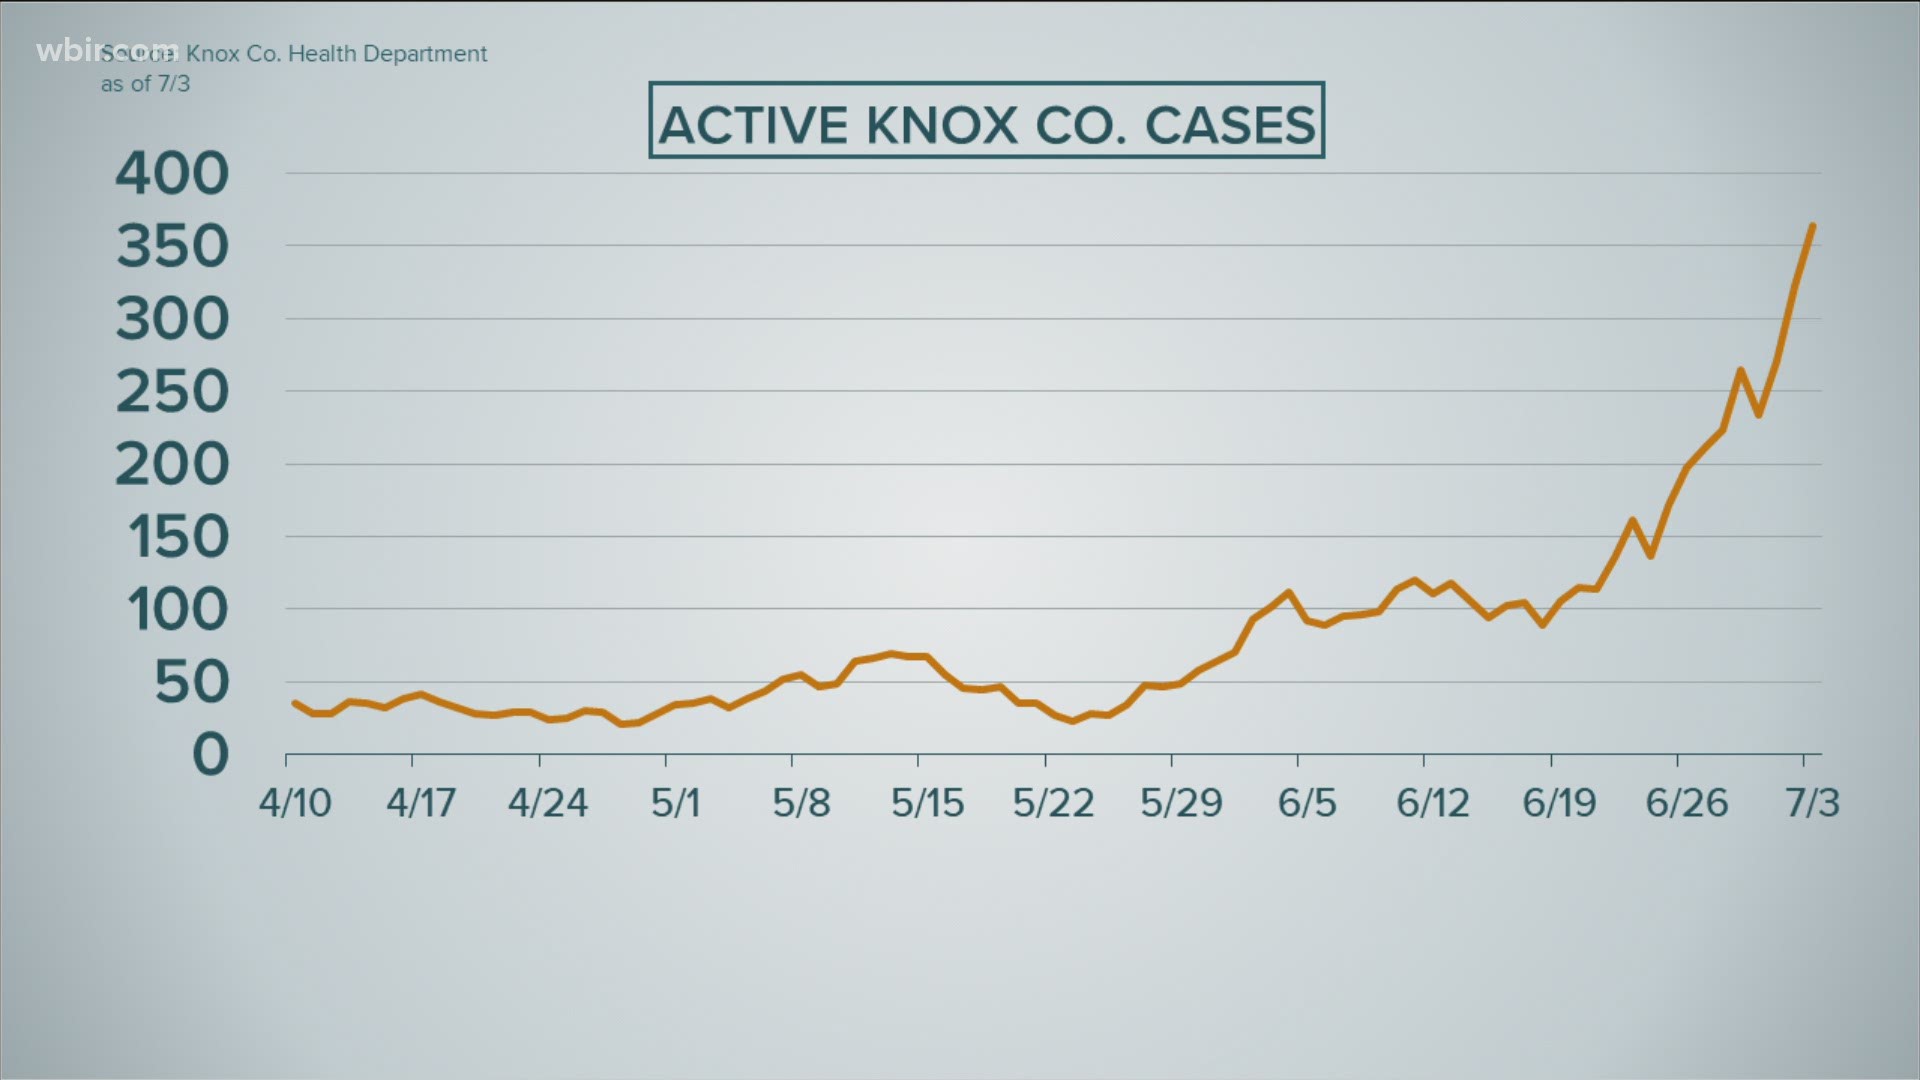
KNOX COUNTY, Tenn. — In East Tennessee, the week of July 13 to July 19 was the worst one yet in terms of the COVID-19 pandemic.
The region reported 1,648 new confirmed cases, bringing the total to 6,340. Although more than 19,000 tests were processed, more than 10 percent came back positive. At the beginning of July, just 6.75 percent were returning positive.
Concurrent hospitalizations hit a new record high per the Knox County Health Department — 110 on July 13 — and 17 additional people died from COVID-19. The deaths were spread across the region in Blount, Cocke, Hamblen, Knox, Loudon, Monroe and Sevier Counties.
The Tennessee Department of Health said about 700 East Tennesseans recovered from COVID-19 during the same time frame. But as of July 19, more than half of East Tennessee counties were above the state threshold for allowing visits to long-term care facilities.
Sixteen counties comprise the Tennessee Department of Health's "East" region: Anderson, Blount, Campbell, Claiborne, Cocke, Grainger, Hamblen, Jefferson, Knox, Loudon, Monroe, Morgan, Roane, Scott, Sevier and Union Counties.
Here's a county-by-county look at how COVID-19 has spread as of July 19 according to the Tennessee Department of Health. This database is updated weekly.
A group of critical care doctors in Tennessee warned Gov. Lee about the worsening numbers in rural and urban counties.
“The governor let local counties and businesses determine how they’ll fight the virus,” Dr. Aaron Milstone said in an email. "Now, COVID-19 is winning the battle and Tennesseans are losing. We’re seeing avoidable deaths and increased suffering for patients and their families."
The maps below show new cases of COVID-19 by county, adjusted for population size and shaded according to the scale recommended by Dr. Milstone and his colleagues. Use the slider to see how the spread has changed in East Tennessee.
Here's what Dr. Milstone and his colleagues said each color represents:
- Green: Less than 1 new case per day per 100,000 people. The virus is spreading but not out of control.
- Yellow: Between 1 to 5 new cases per day per 100,000 people. This means there should be interventions in place to begin slowing the spread: mask mandates, physical distancing requirements, accountability for people who endanger others.
- Orange: 5-10 new cases per day per 100,000 people. Worsening spread, if interventions are not in place you are falling behind.
- Red: 10-20 new cases per day per 100,000 people. This is trouble. When the virus is spreading greater than 10 new cases per day per 100,000 people without interventions in place, the chances of asymptomatic transmission is increasing greatly.
- Dark Red: Over 20 new cases per day per 100,000 people. This is spread where failure to intervene with physical distancing requirements and mask mandates has become reckless, dangerous and the threat to public health and health care infrastructure risk at its greatest

